Hurricane Maria, a Category 5 storm, struck Puerto Rico on September 20, 2017, claiming over 3000 lives.
This example assesses wind-induced damage for Vieques Island, Puerto Rico, using peak gust wind speed data from the National Institute of Standards and Technogology (NIST) and inventory of about 900 wood residential buildings. The inventory was created using a Python Notebook with BRAILS and formatted to a HAZUS-type damage assessment in R2D. The final R2D results include damage state and loss estimations.
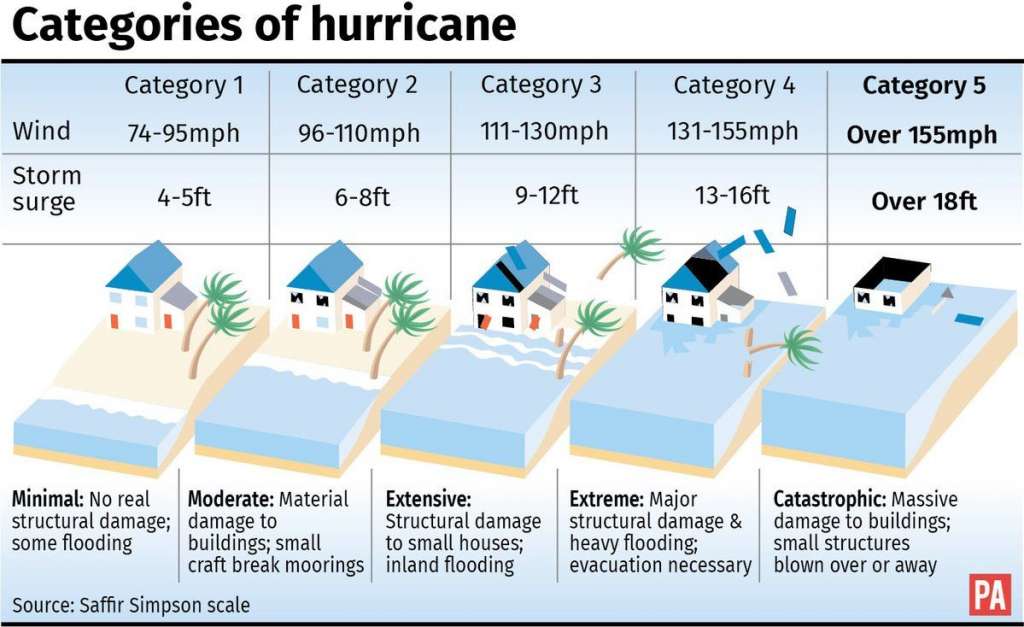
Hurricanes are powerful tropical storms producing strong winds and heavy rains. The Saffir-Simpson Wind Scale, which categorizes hurricanes from 1 to 5 based on sustained wind speeds, helps estimate potential property damage [Saf73]. Hurricanes in categories 3 and above are deemed major due to their significant destructive potential.
Hurricane Maria (Category 5) destroyed several homes and health facilities in Puerto Rico, including the only healthcare center on Vieques Island, exacerbating the island’s health crisis after decades-long military use.
A recent study by Guerra-Velasquez [GV22] highlithed that infrastructure weaknesses made recovery more challenging and emphasize the need for increased resiliency and preparedness for future disasters.
The proposed solution gathers input data for a HAZUS-type damage and lossess analysis implemented in R2D. The dataset includes a baseline hazard, building inventory, and rulesets.
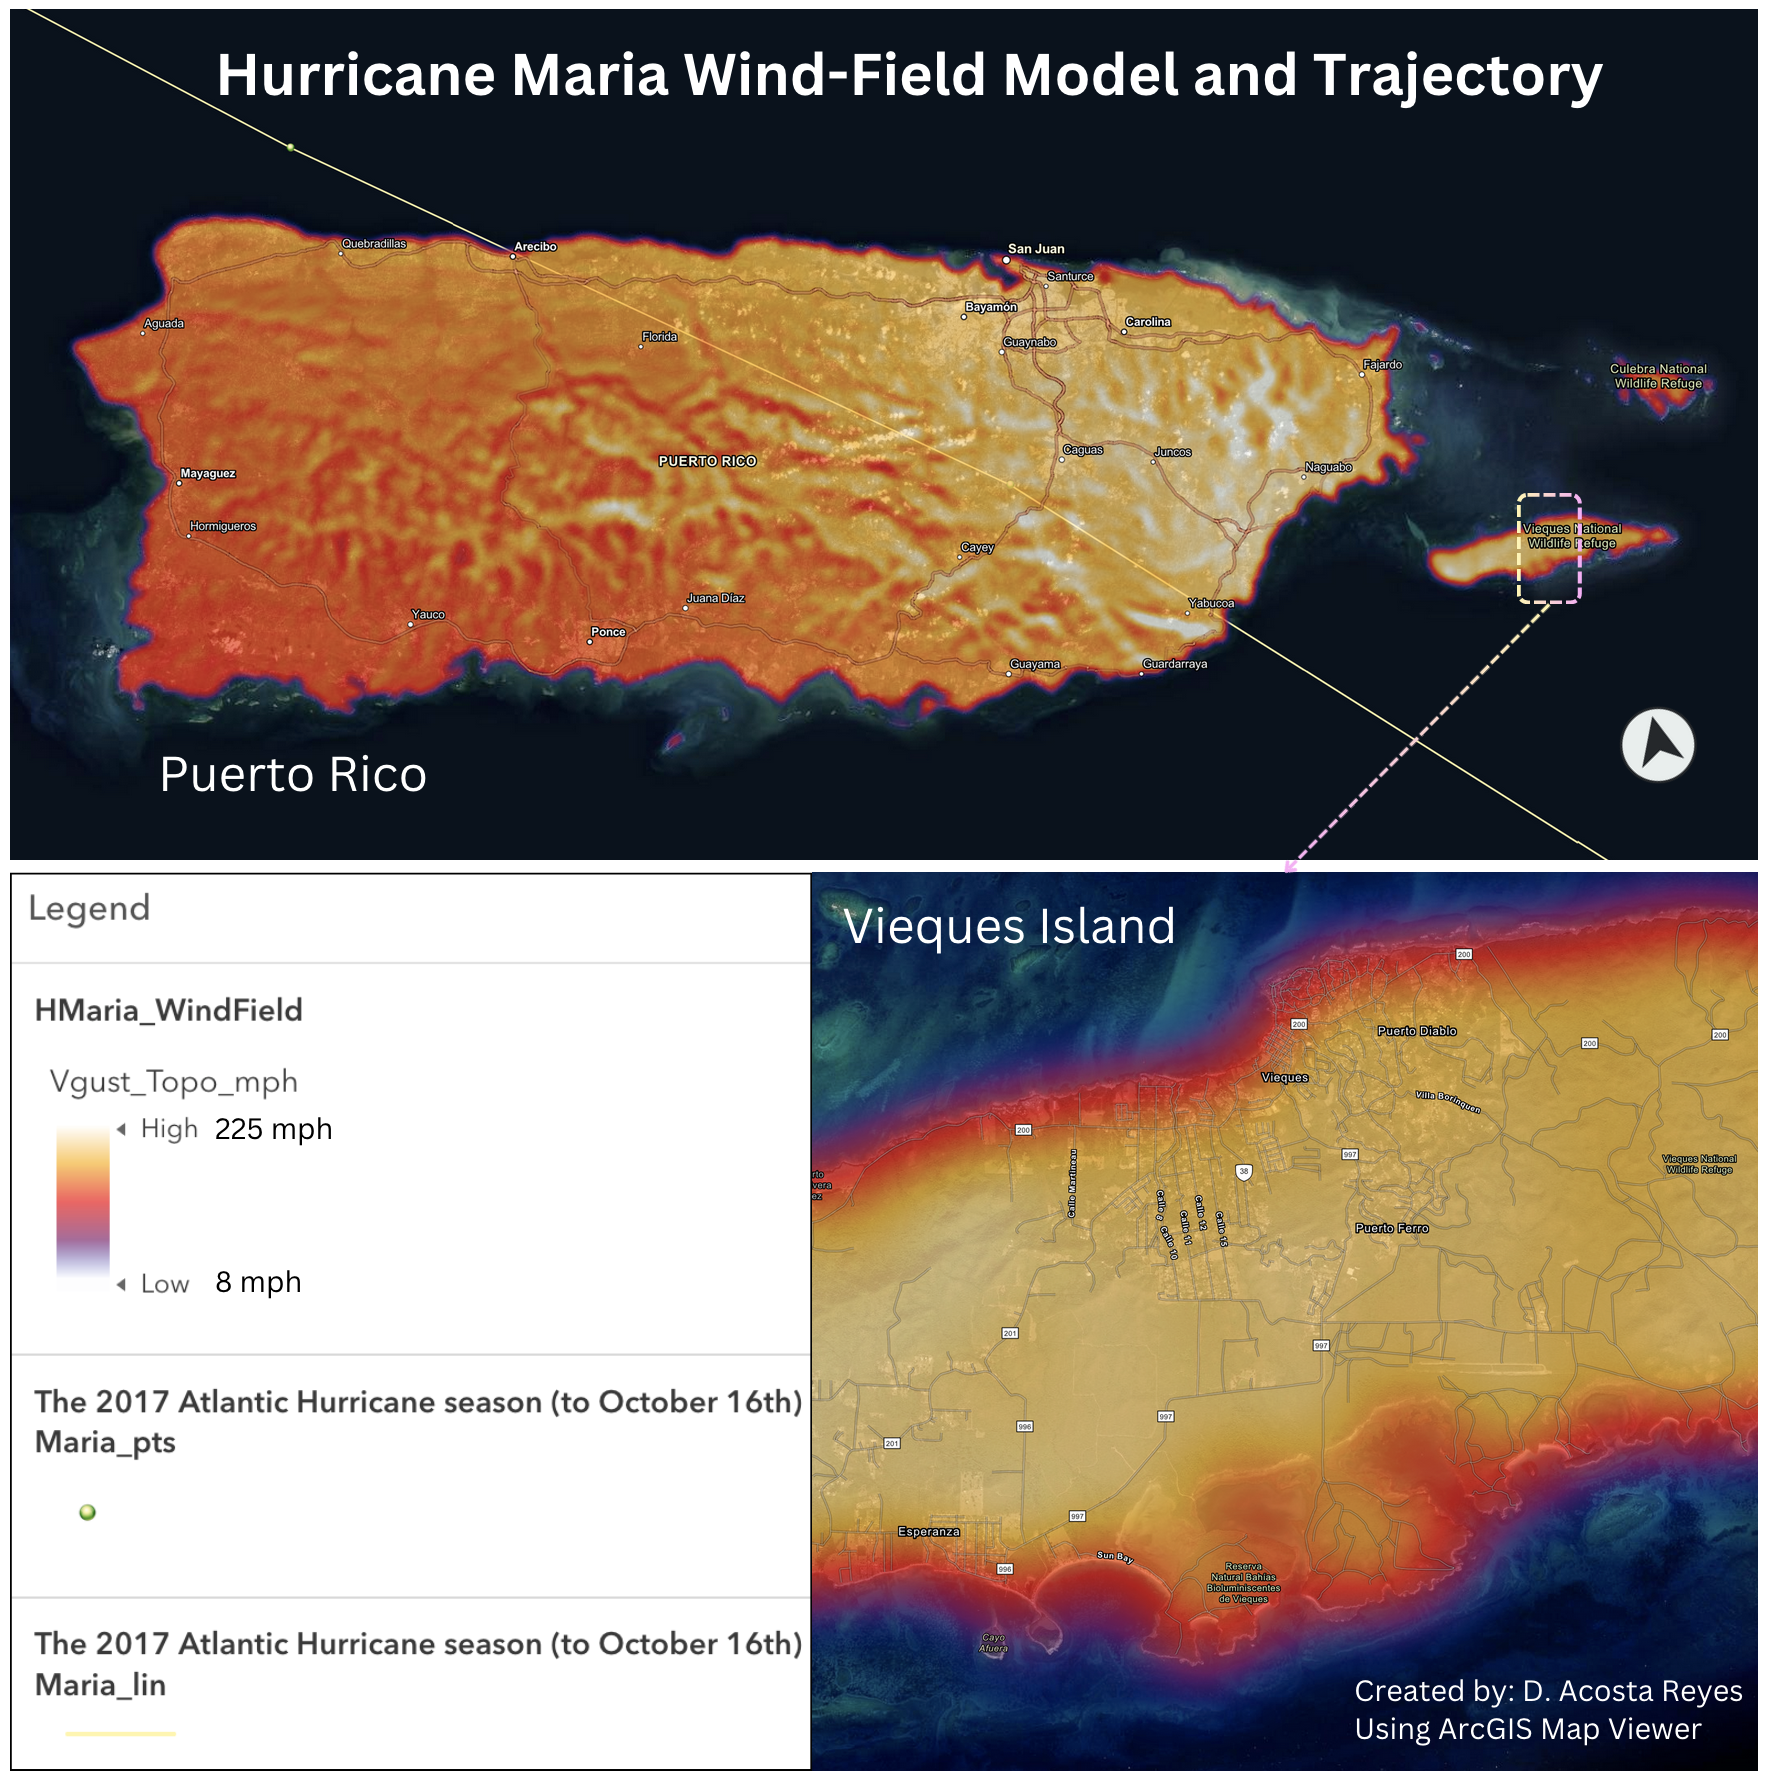
Fig. 2. Raster visualization of Hurricane Maria Wind-Field Model.
Building Inventory: The building inventory for Puerto Rico is limited. However, using NHERI-SimCenter Building and Infrastructure Recognition using AI at Large-Scale (BRAILS) capabilities, it is possible to obtain building footprints and their associated attributes for a given location. Brails was implemented in a Jupyter Notebook to:
Obtain building footprints from open repositories (e.g., NSI)
Fetch Google Street Views using Google API
Import essential BRAILS modules such as NumberOfFloors, YearBuilt, and OccupancyClassifier
Merge and create a Building Inventory Model (BIM) with required attributes for rulesets.
A sample code to obtain bulding inventories is provided below. Make sure to !pipinstallbrails before running.:
''' Import modules '''frombrails.workflow.FootprintHandlerimportFootprintHandlerfrombrails.workflow.NSIParserimportNSIParserfrombrails.workflow.ImHandlerimportImageHandler''' Building parameters '''# Define query location:name_key='Vieques_2'location=Lajas,PuertoRico# location = (lonmin, latmin, lonmax, latmax) # supports exten/bounding box format# Define footprint source:# fpSource included in BRAILS are i) OpenStreetMaps,# ii) Microsoft Global Building Footprints dataset, and iii) FEMA USA Structures.# The keywords for these sources are osm, ms, and usastr, respectively.footprint_source='osm'# Length units for the attributes (used when relevant):lengthunit='m'# Options are 'm' or 'ft'# File where the building inventory will be stored:outputfile='BuildingInventory.geojson'.format(name_key)''' Initialize and Run BRAILS modules '''# Initialize FootprintHandler:fpHandler=FootprintHandler()# Run FootprintHandler to get the footprints for the entered location:fpHandler.fetch_footprint_data(location,fpSource=footprint_source,outputFile='{0}_Footprints.geojson'.format(name_key),lengthUnit=lengthunit)footprints=fpHandler.footprints.copy()# Initialize NSIParser:nsiParser=NSIParser()# Run NSIParser to merge the footprint data with NSI points:nsiParser.GetNSIData(footprints,outfile=outputfile,lengthUnit=lengthunit)
Note
Complete Jupyter notebook can be accessed in DesignSafe - Data Depot at PRJ-4604/Losses_Damage_R2D under the name InventoryBRAILS-notebook.ipynb.
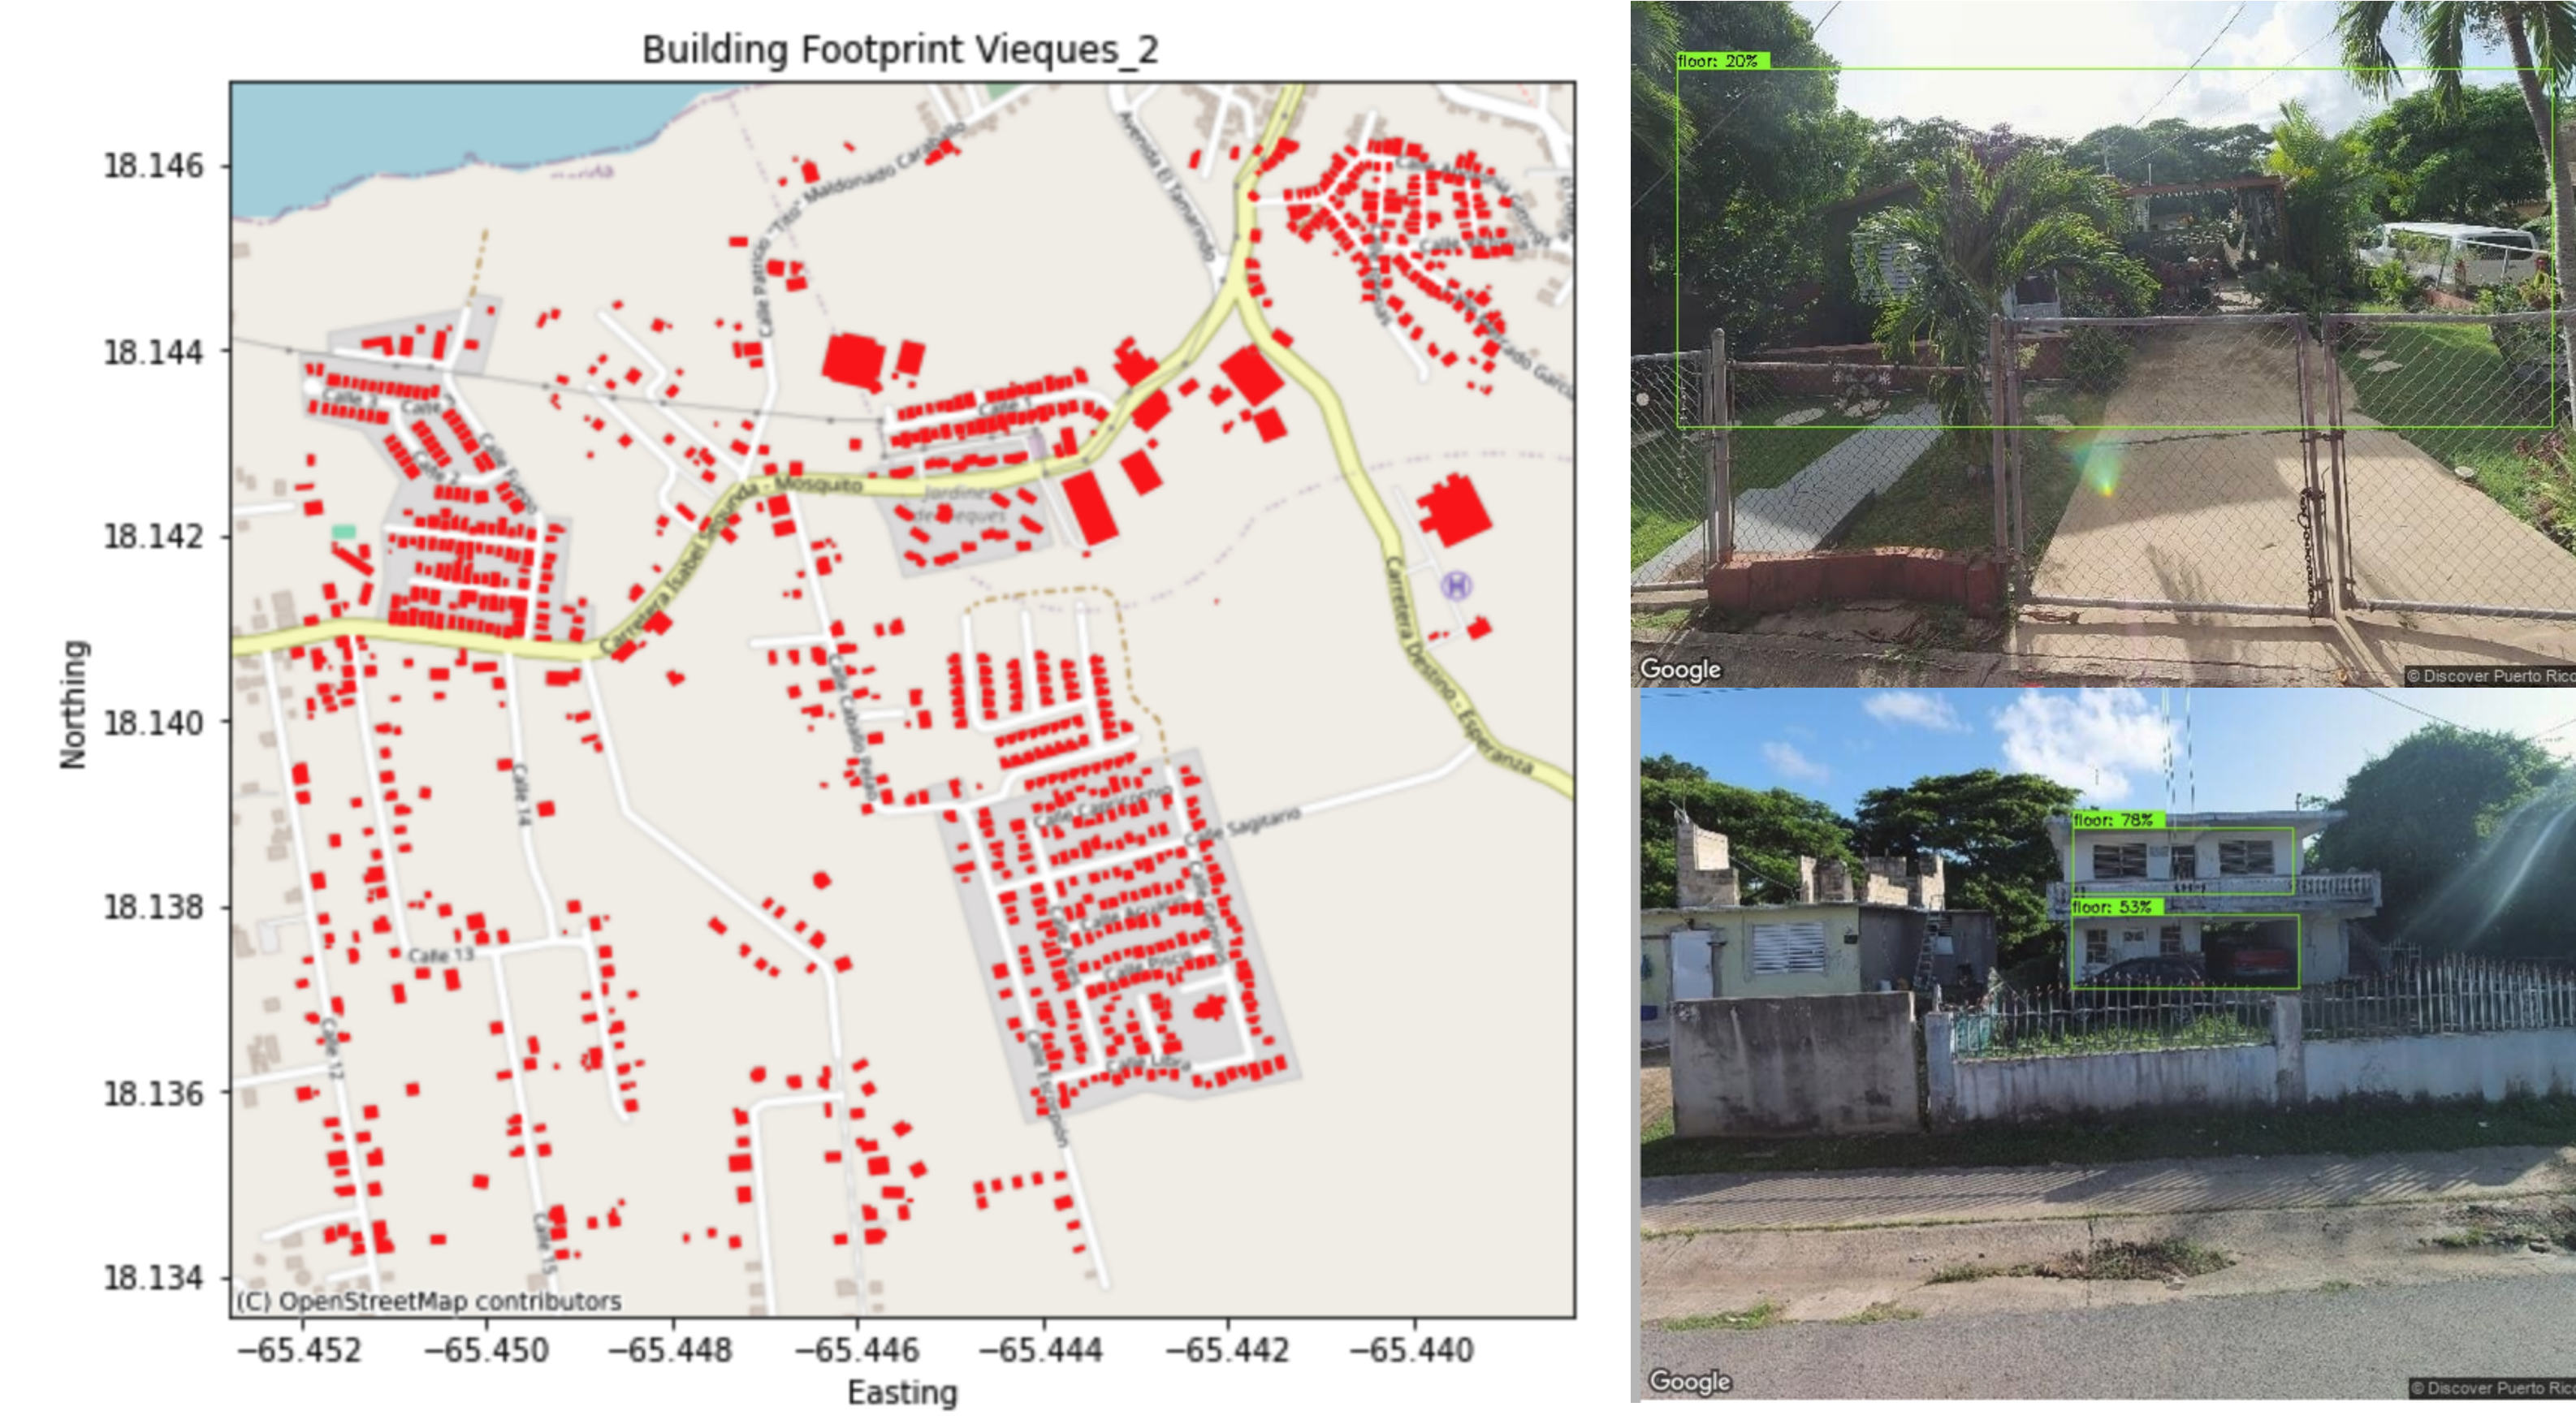
Fig. 3. Sample of 932 Building Footprints in Vieques, Puerto Rico, and BRAILS NumberOfFloors module generator.
HAZUS Rulesets:HAZUS is a tool for risk modeling methodology that is implemented in R2D. To conduct damage and loss assessments, the software uses rulesets that parses building attributes such as occupancy, year built, roof height, and others. For this example, the HAZUS rulesets were obtained and modified from E8 - Hurricane Wind Example in R2D documentation.
This example uses the Regional Resilience Determination Tool (R2D) for wind damage and loss estimations in a residential area in Vieques, Puerto Rico, in order to assess the impact of wind forces and improve infrastructure resilience for future events.
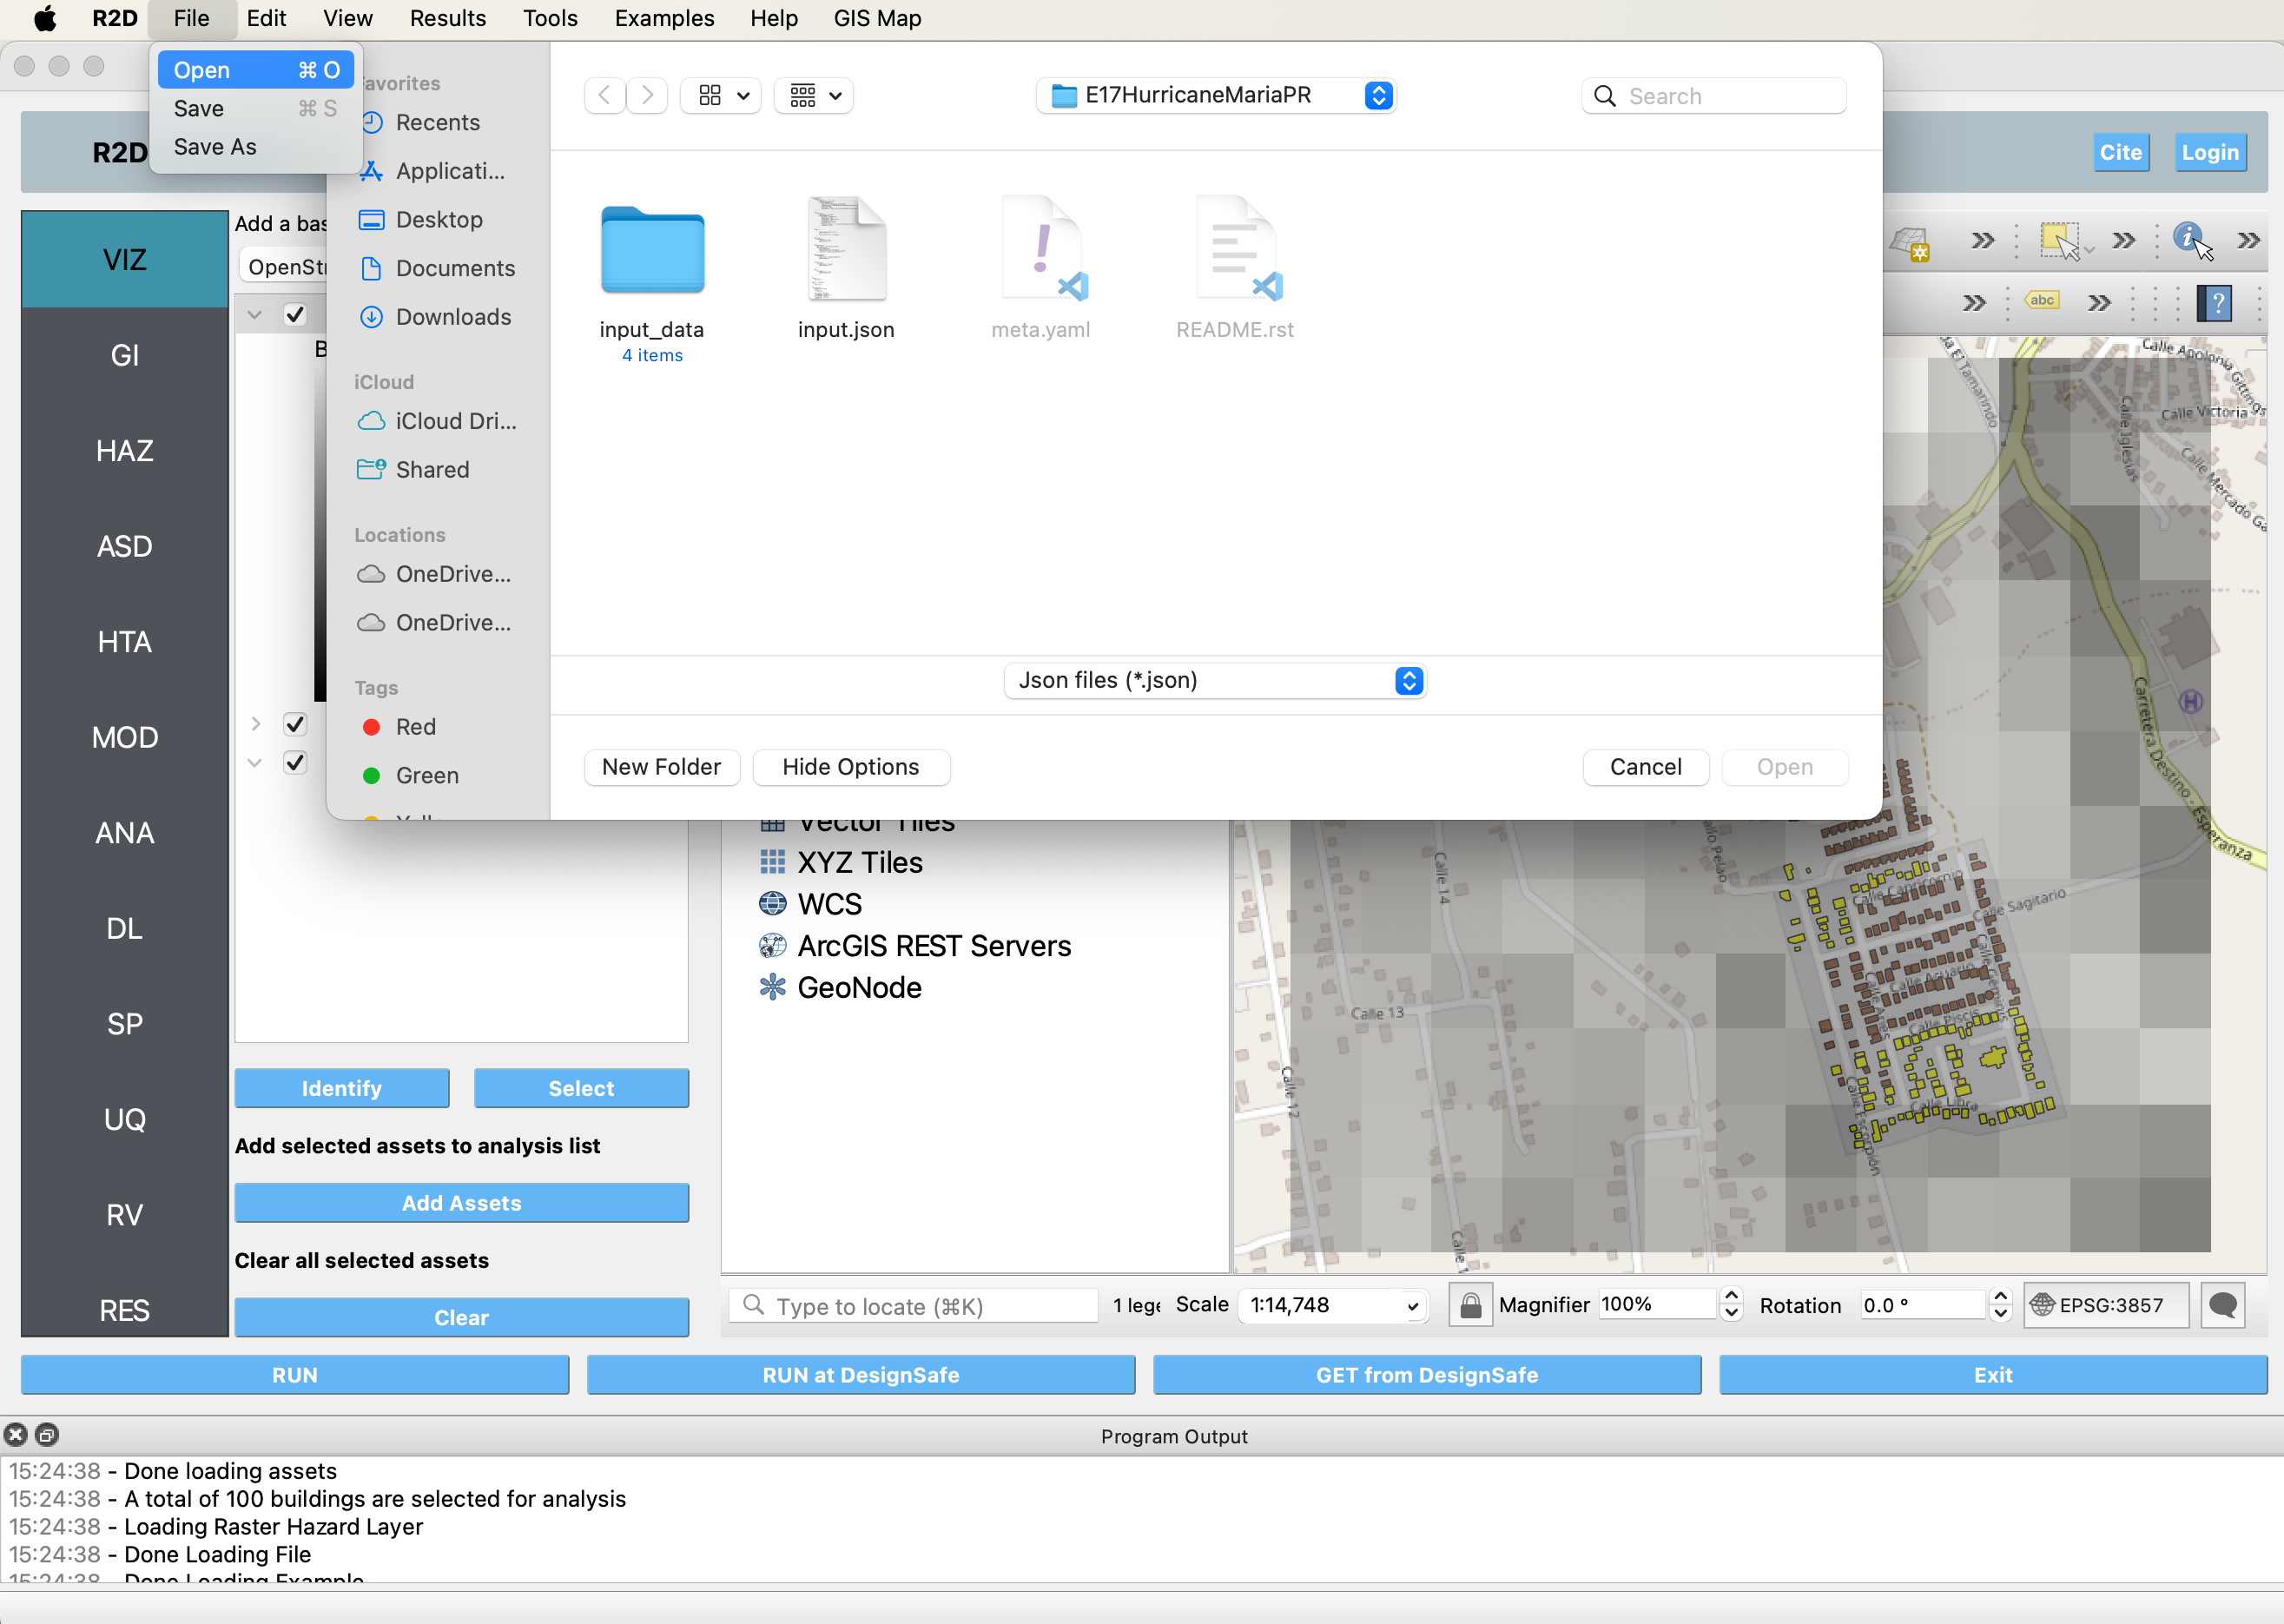
You will notice that all the inputs are autopopulated. Make sure to follow the next steps to verify they are in the correct units and using the right file references.
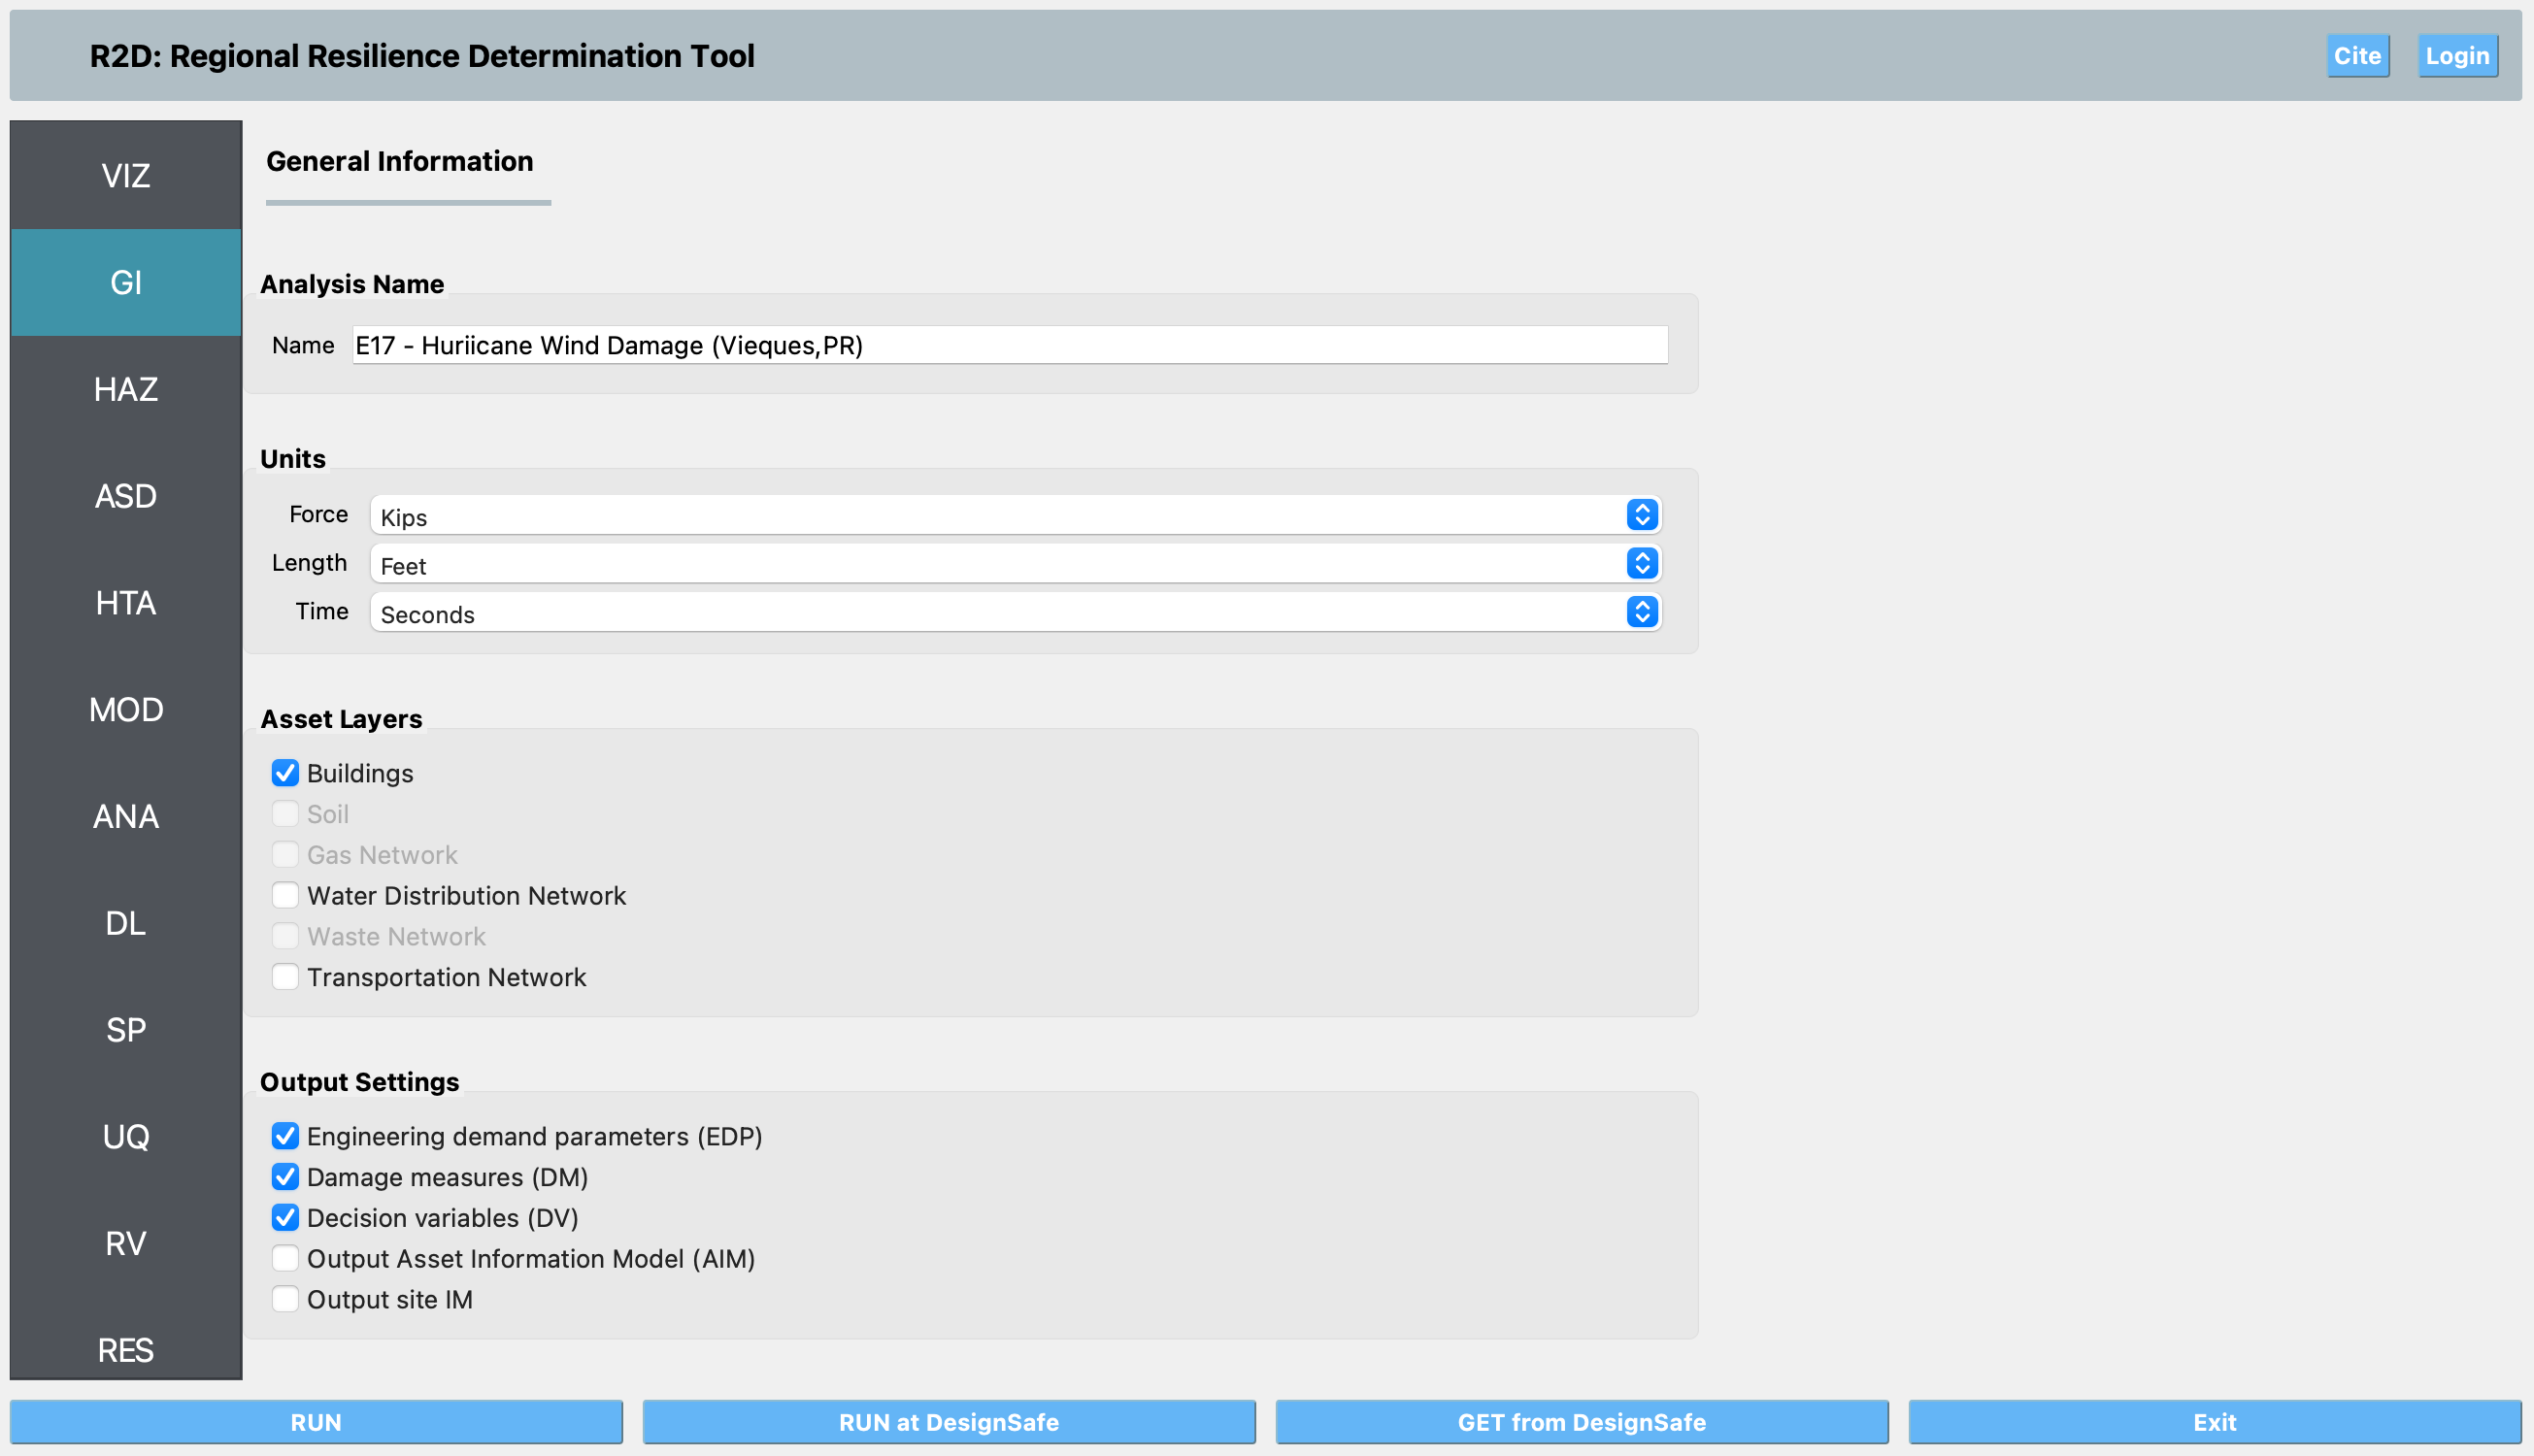
In the GI panel, set the Analysis Name, Units, Asset Layers, and Output Settings.
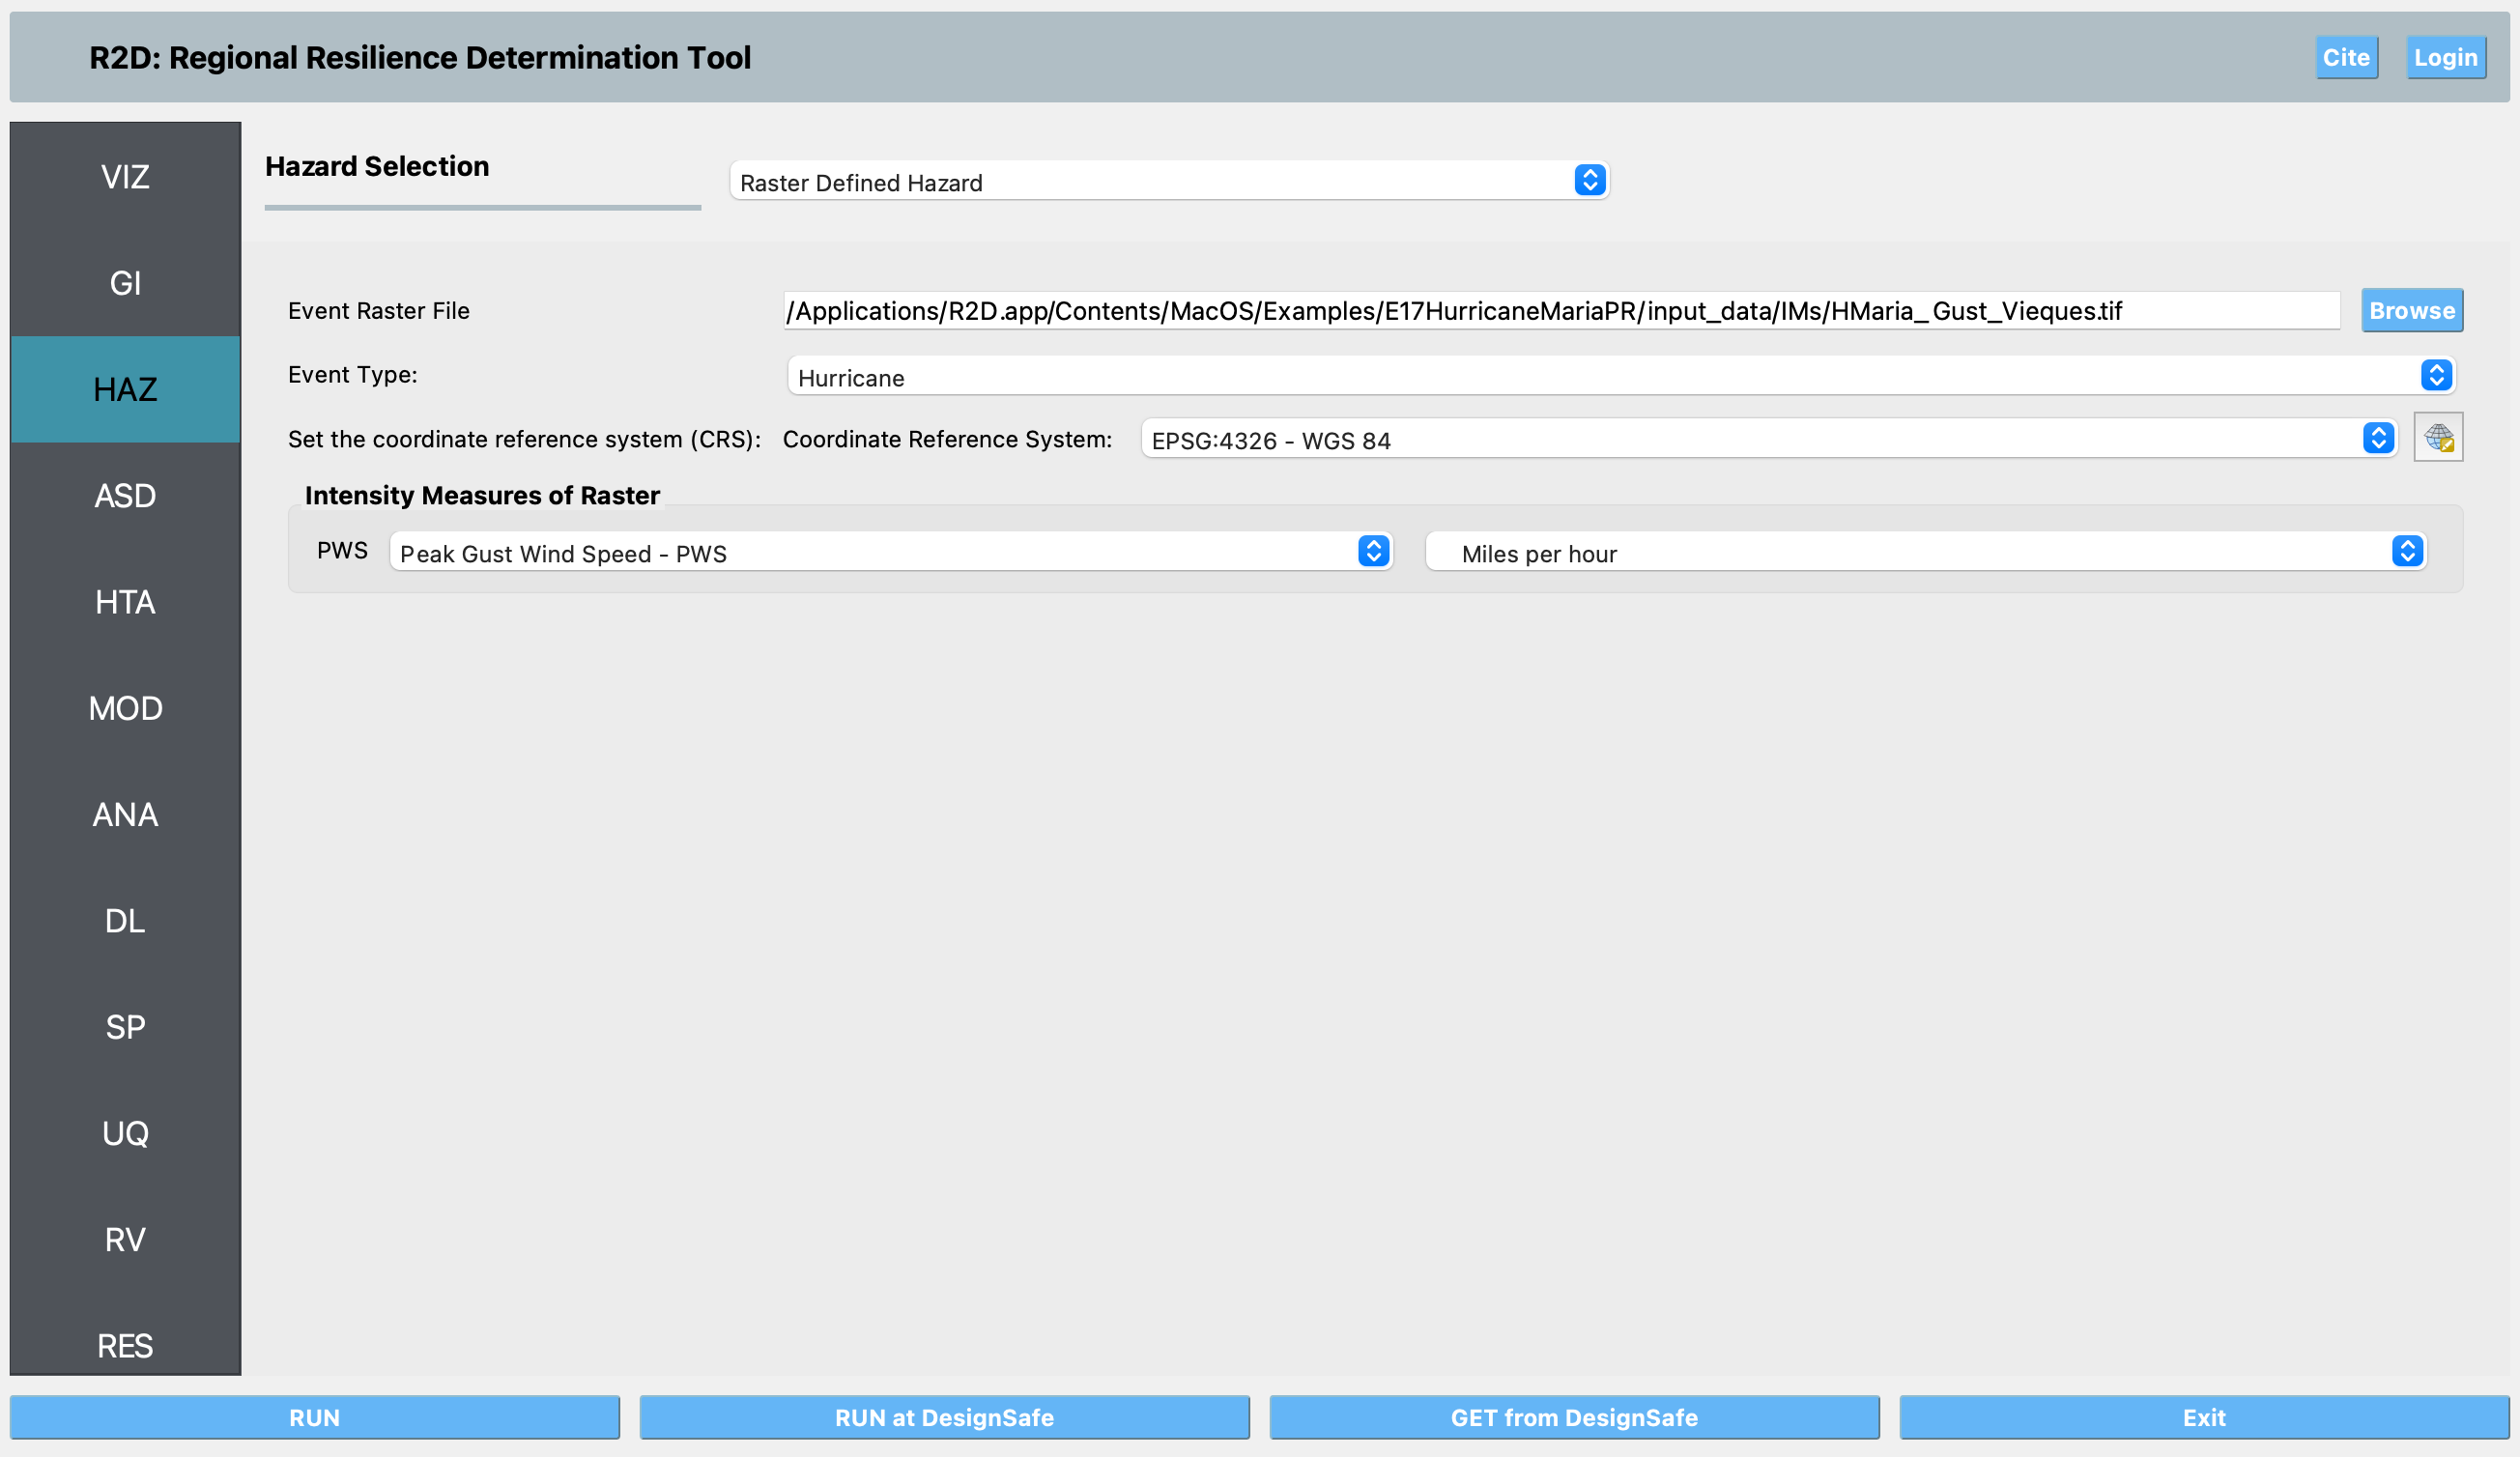
For the HAZ Hazard Selection, select “Raster Defined Hazard” for an Event Type: “Hurricane”. The Intensity Measures of Raster is “Peak Gust Wind Speed - PWS” in mph.
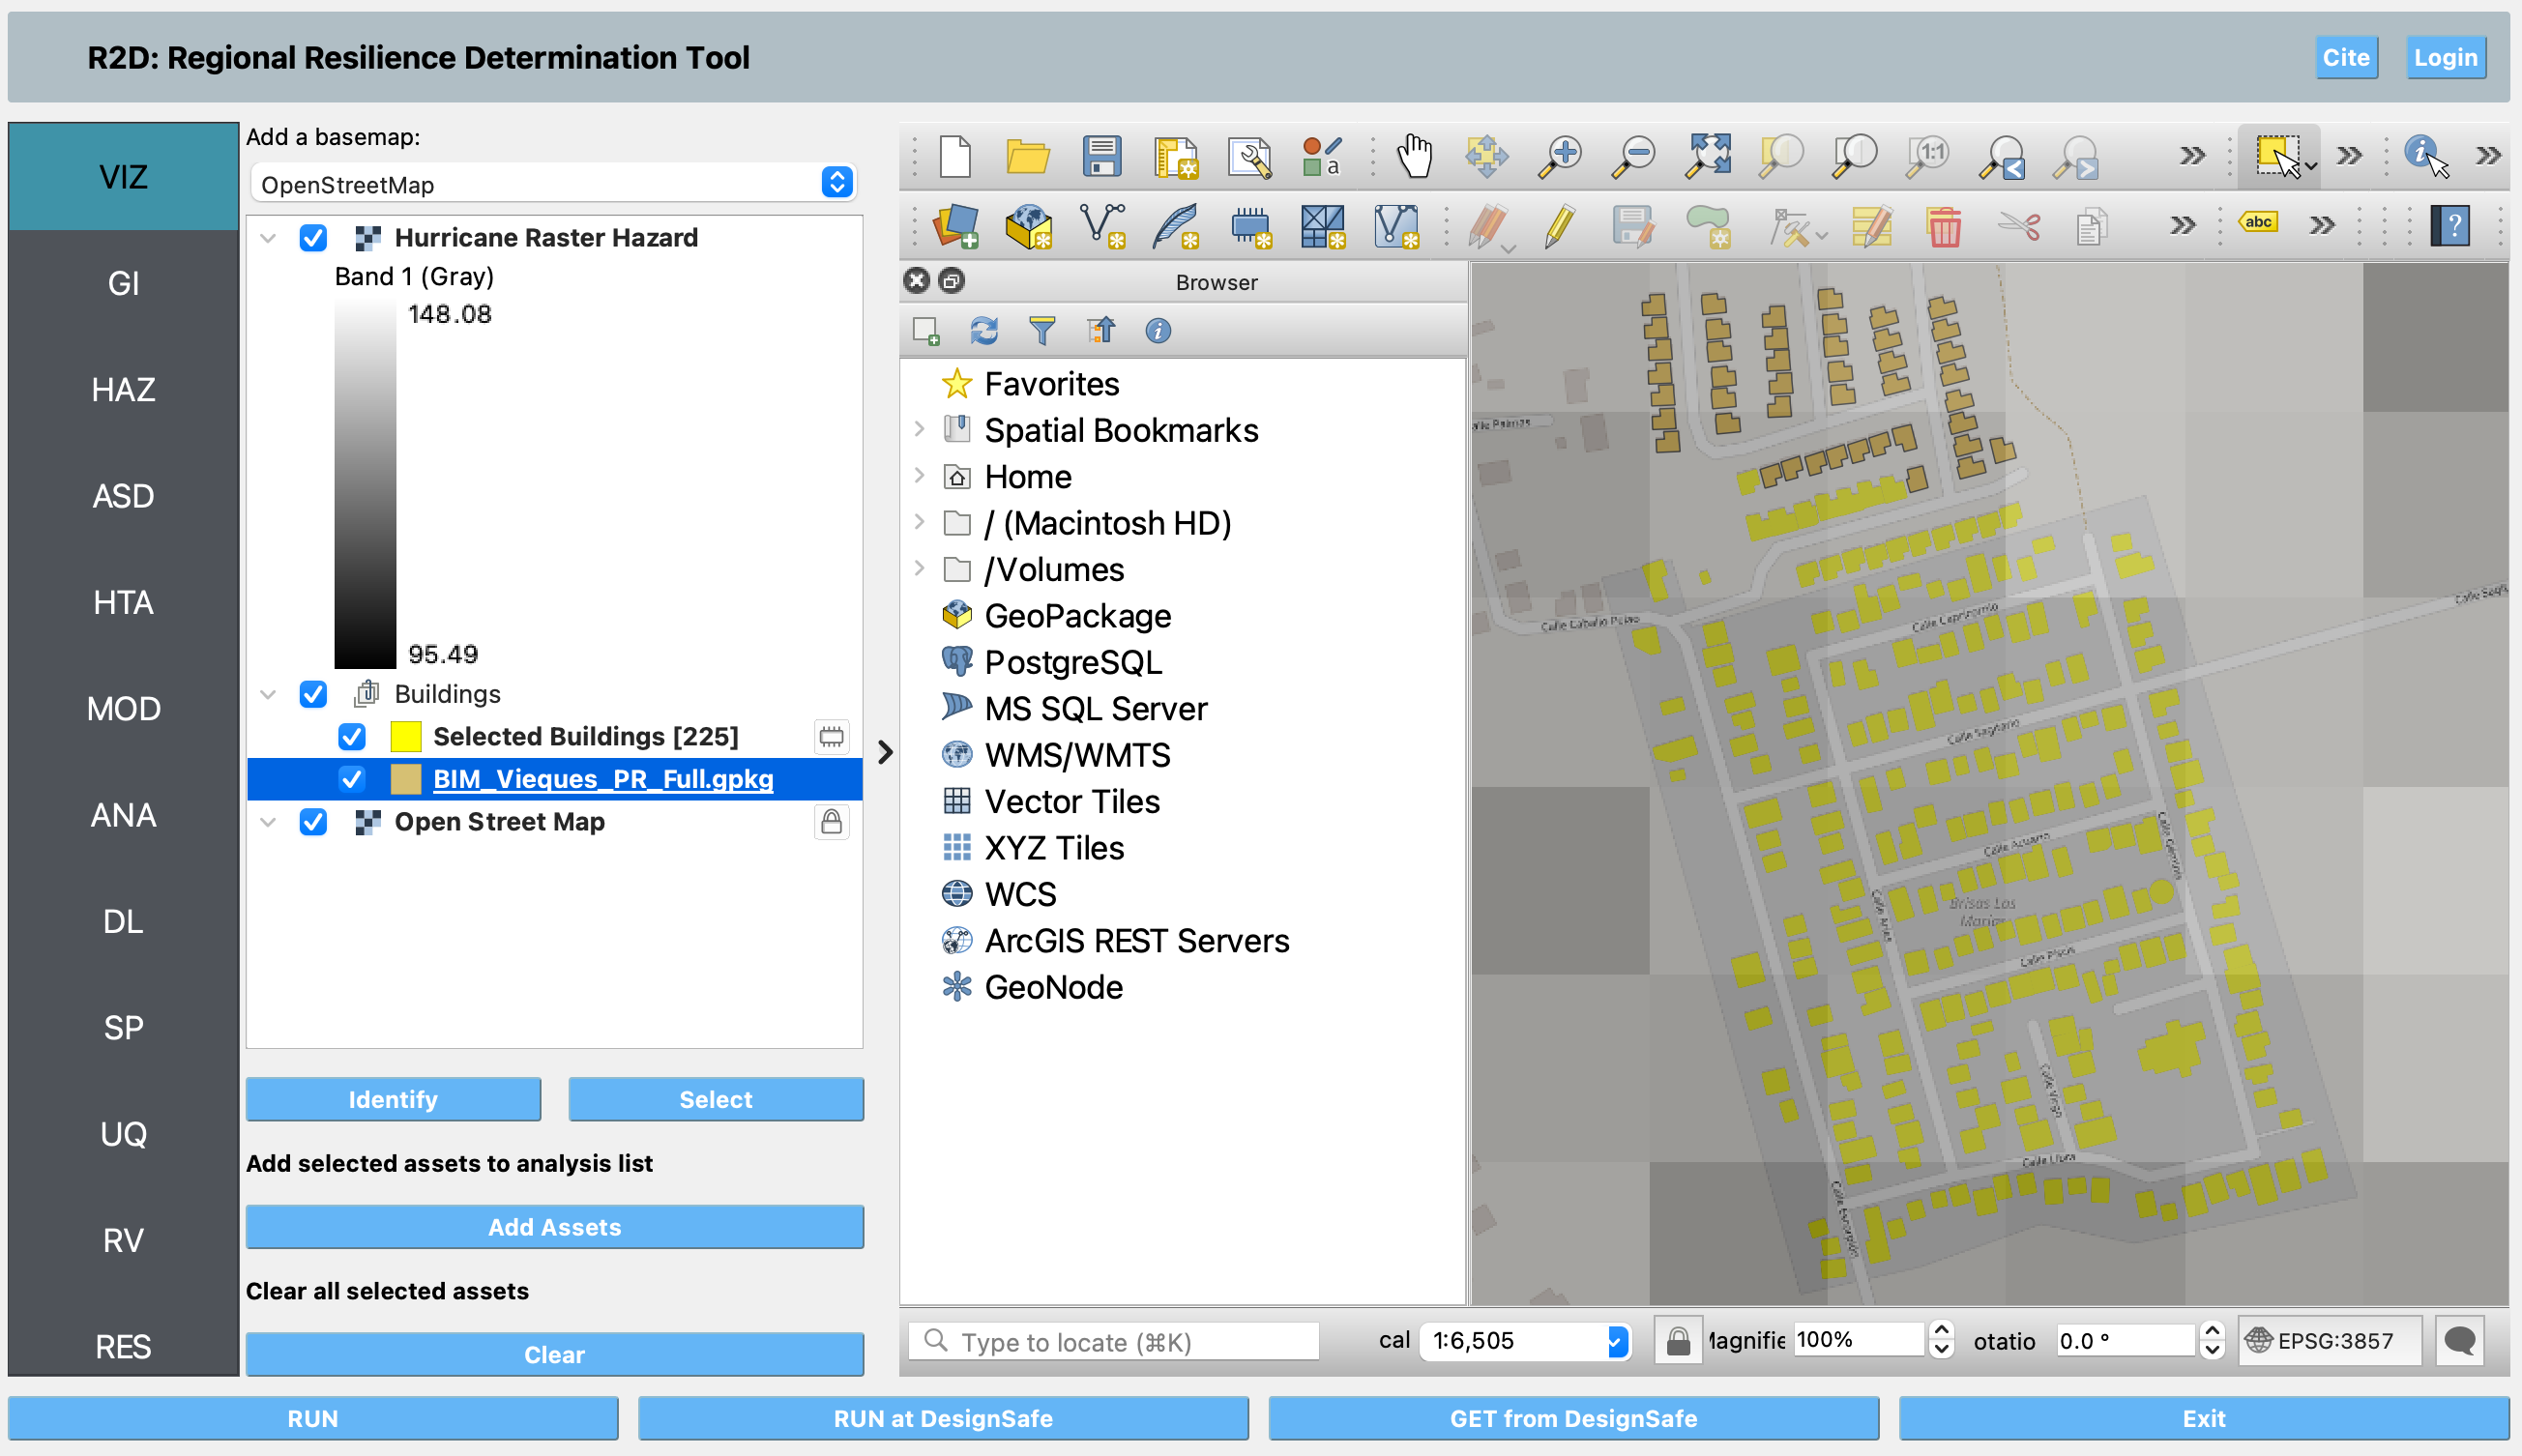
In the ASD panel, make sure the Regional Building Inventory is set to “GIS File to AIM”. Select the Assets to Analyze as intervals (e.g., 1-100) or go back to panel VIZ to manually select your assets by i) ‘click’ on the inventory layer; ii) push “Select” button (then drag selection in the map); iii) push “Add Assets” button.
Fig. 7 (a). R2D ASD Assets Selection by Intervals.
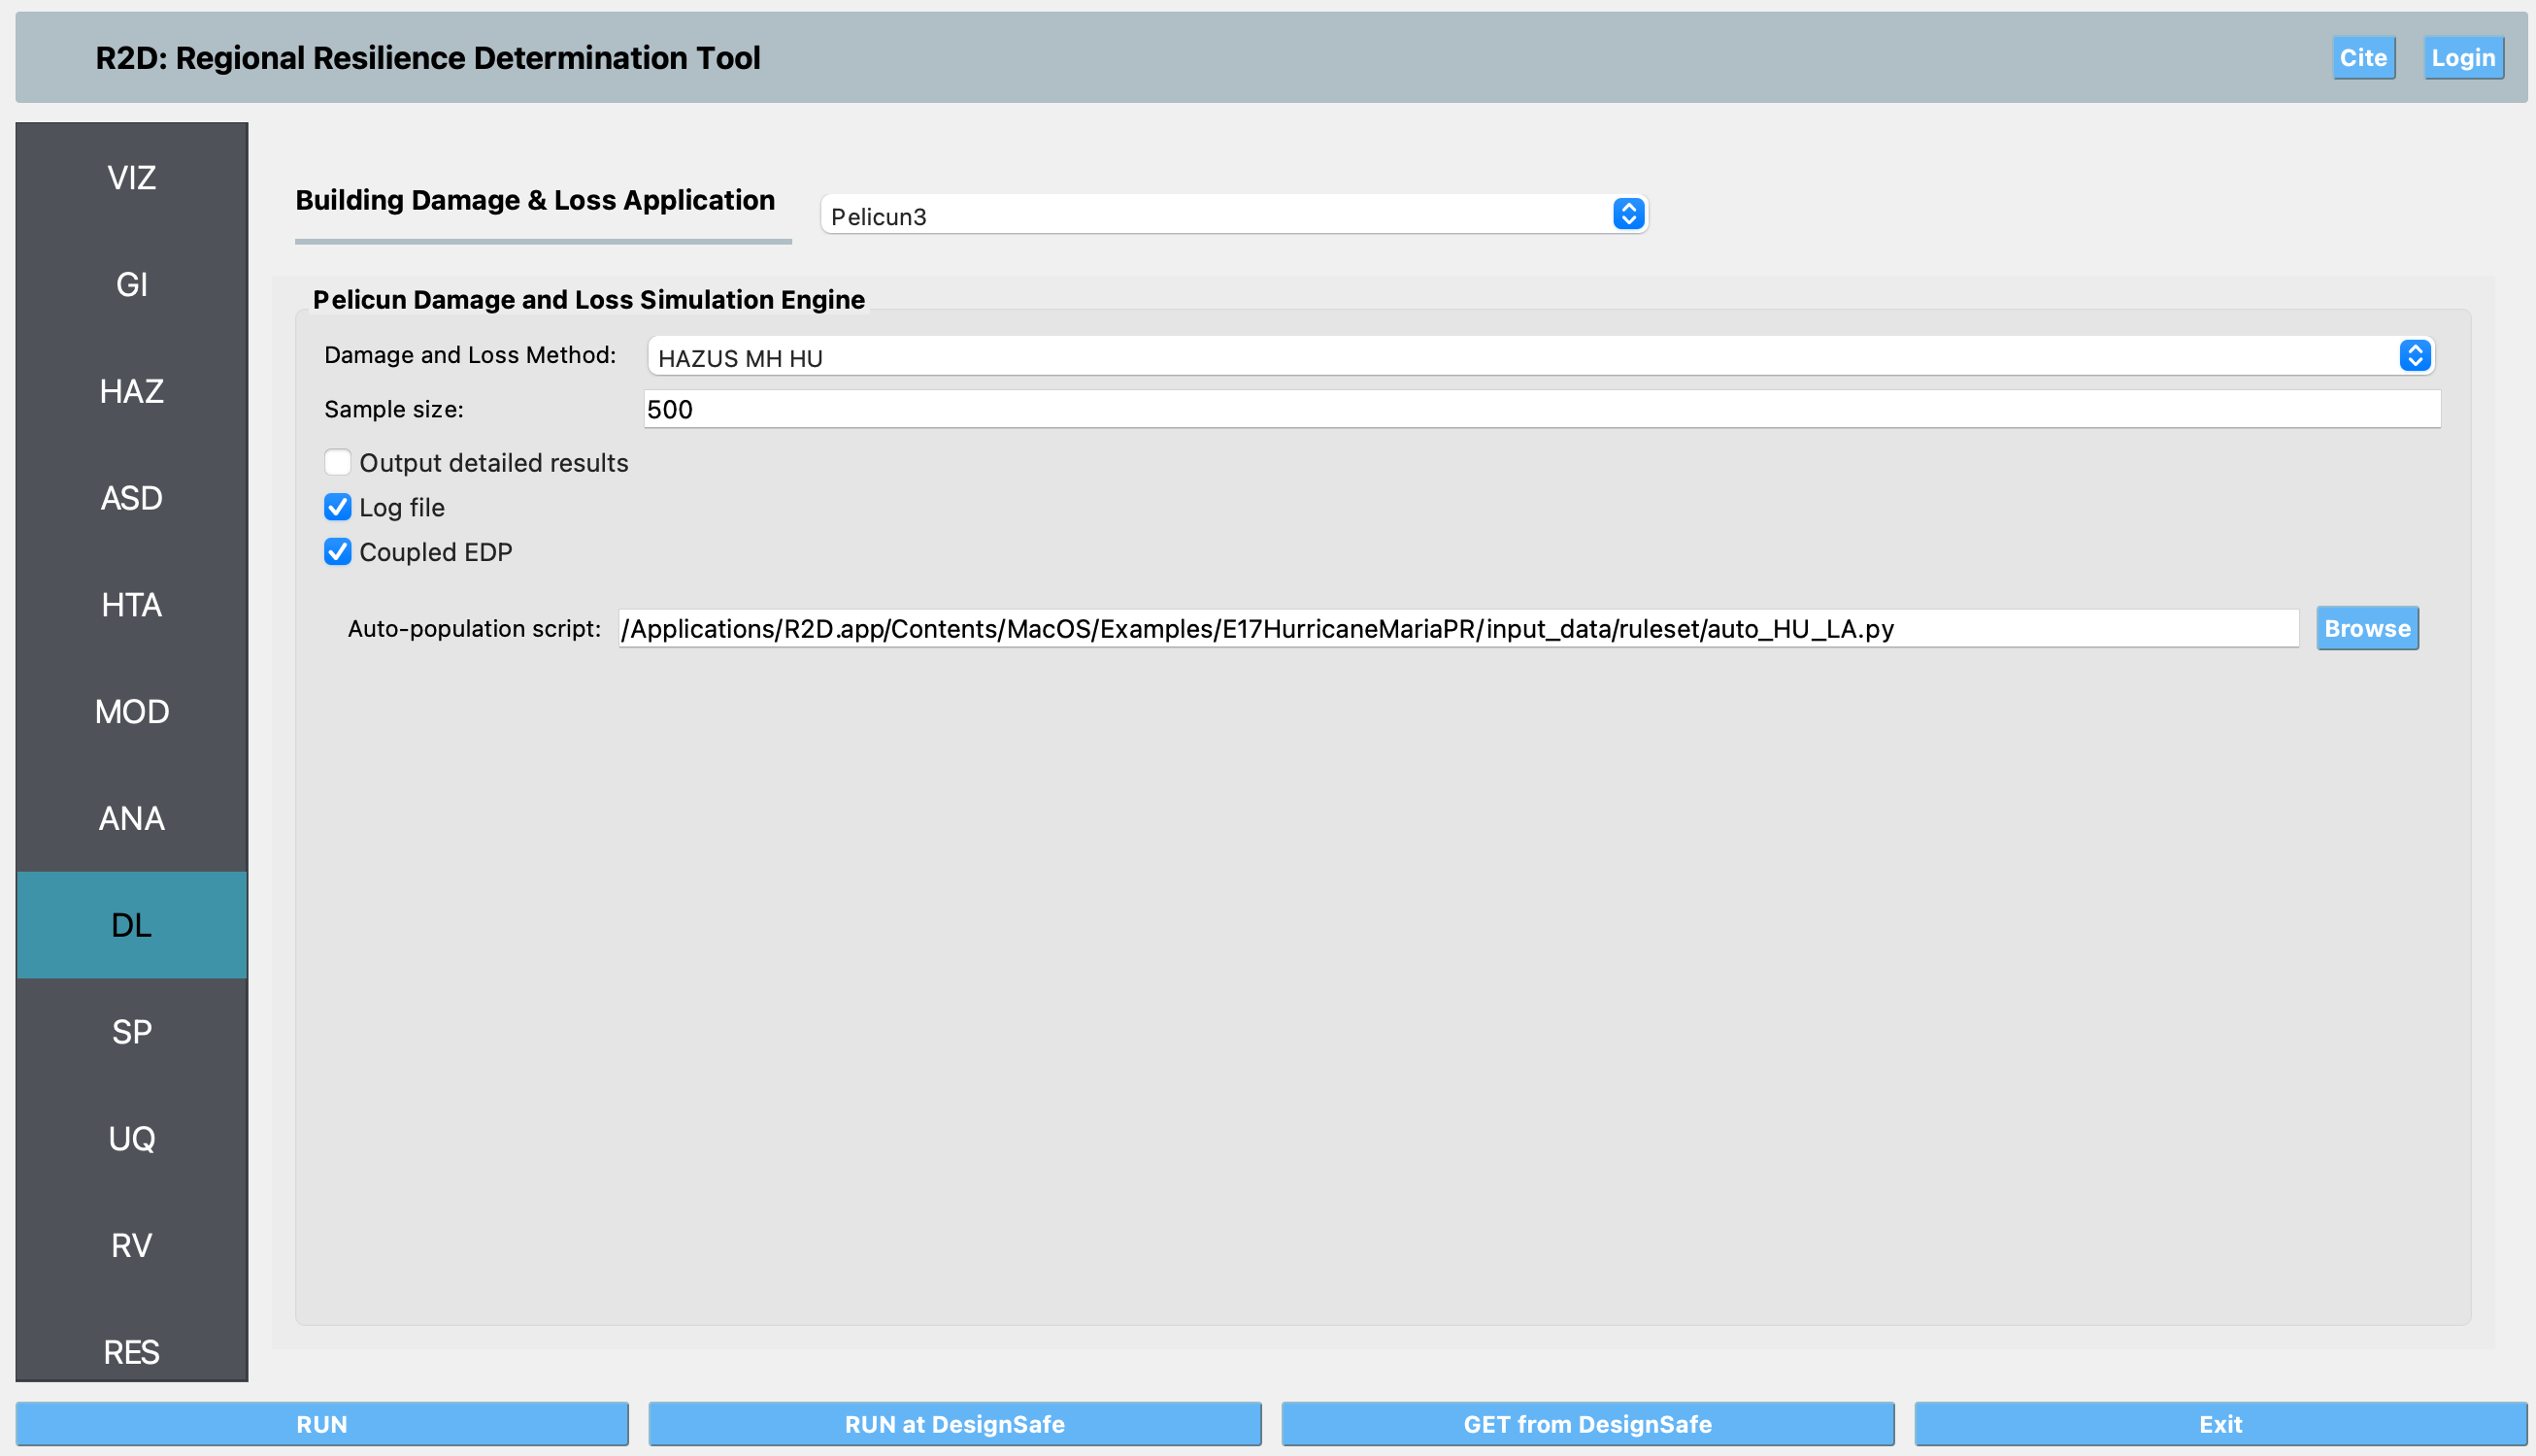
Damage & Loss Apllication is found in the DL panel. Here you select “Pelicun3” with Damage and Losss Method “HAZUS MH MU”. The Auto-population script referring to the specified ruleset is “auto_HU_PR.py” file.
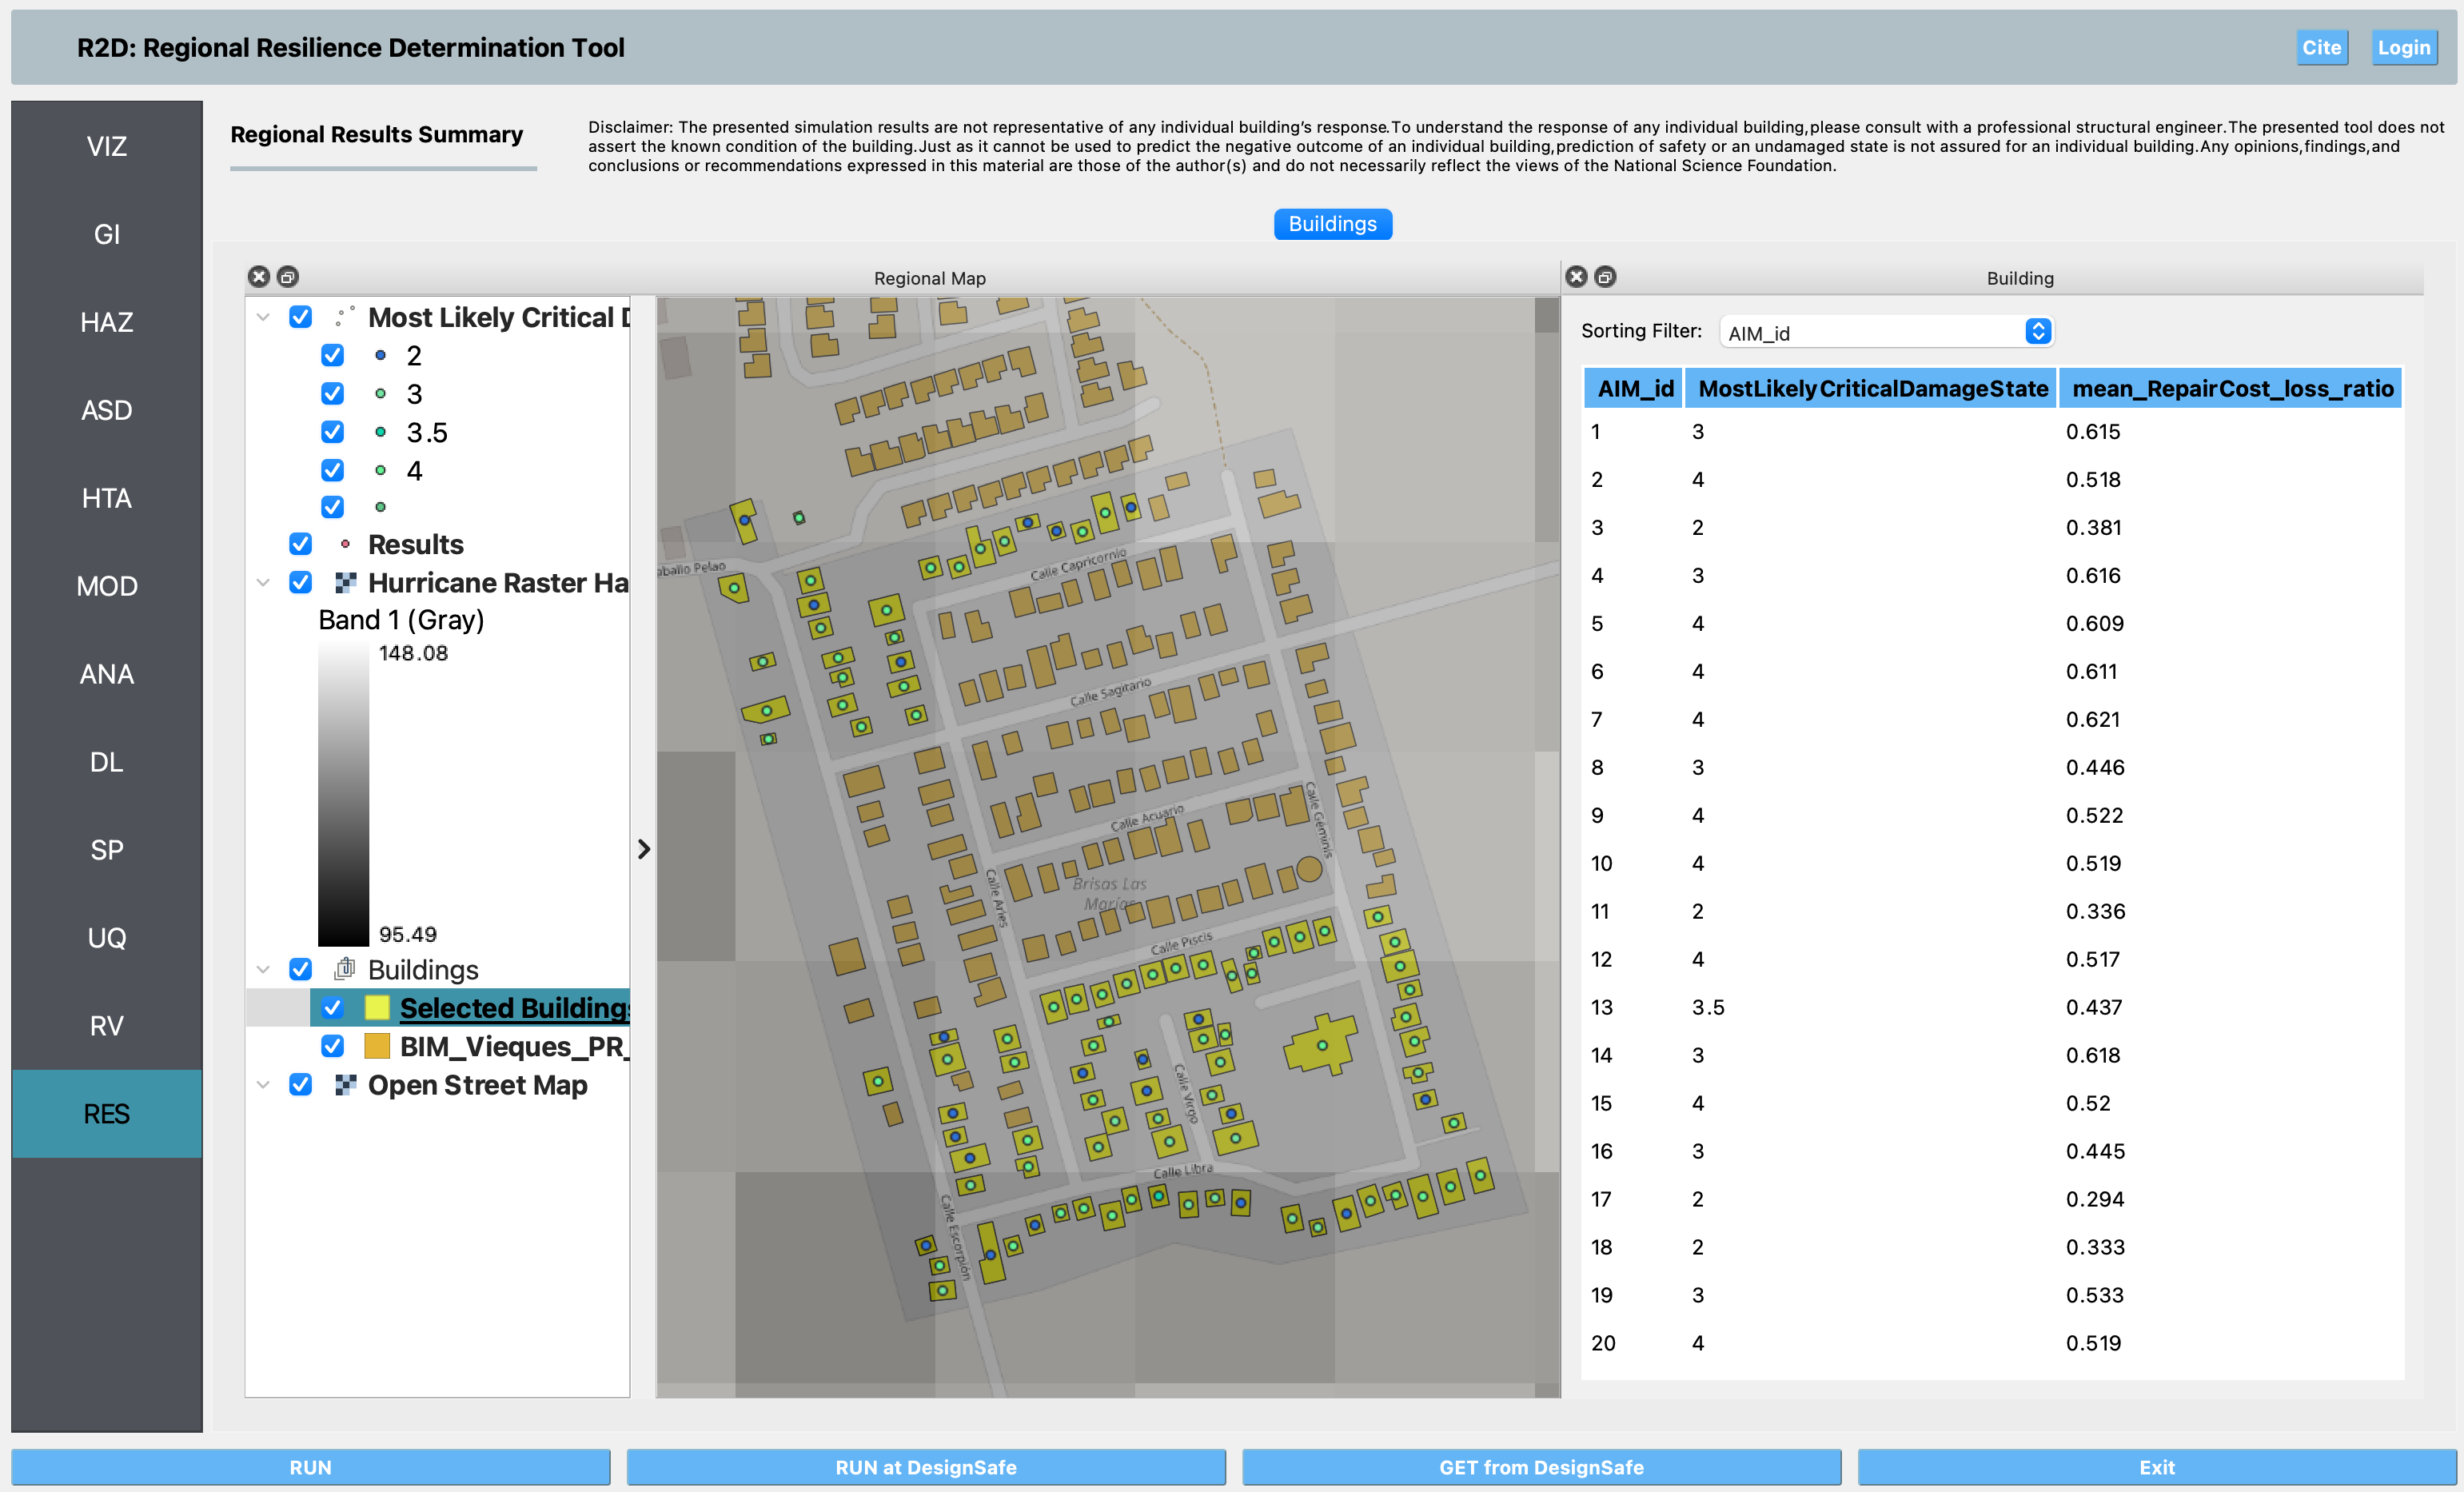
mean_RepairCost_loss_ratio: The repair cost loss ratio is computed as a ratio of an estimated repair cost and wind-induced damage. The standard deviation of this variable is also provided as std_RepairCost_loss_ratio. This ratio goes on a scale from 0 to 1 and correlates with the Damage State (DS) variable. A typical breakdown corresponds to:
DS0 - Loss ratio 0%
DS1 - Loss ratio 2%
DS2 - Loss ratio 10%
DS3 - Loss ratio 50%
DS4 - Loss ratio 100%
The results suggest that -of the 100 buildings assessed- most would suffer Severe Damage to Destruction given the inventory information.
Note
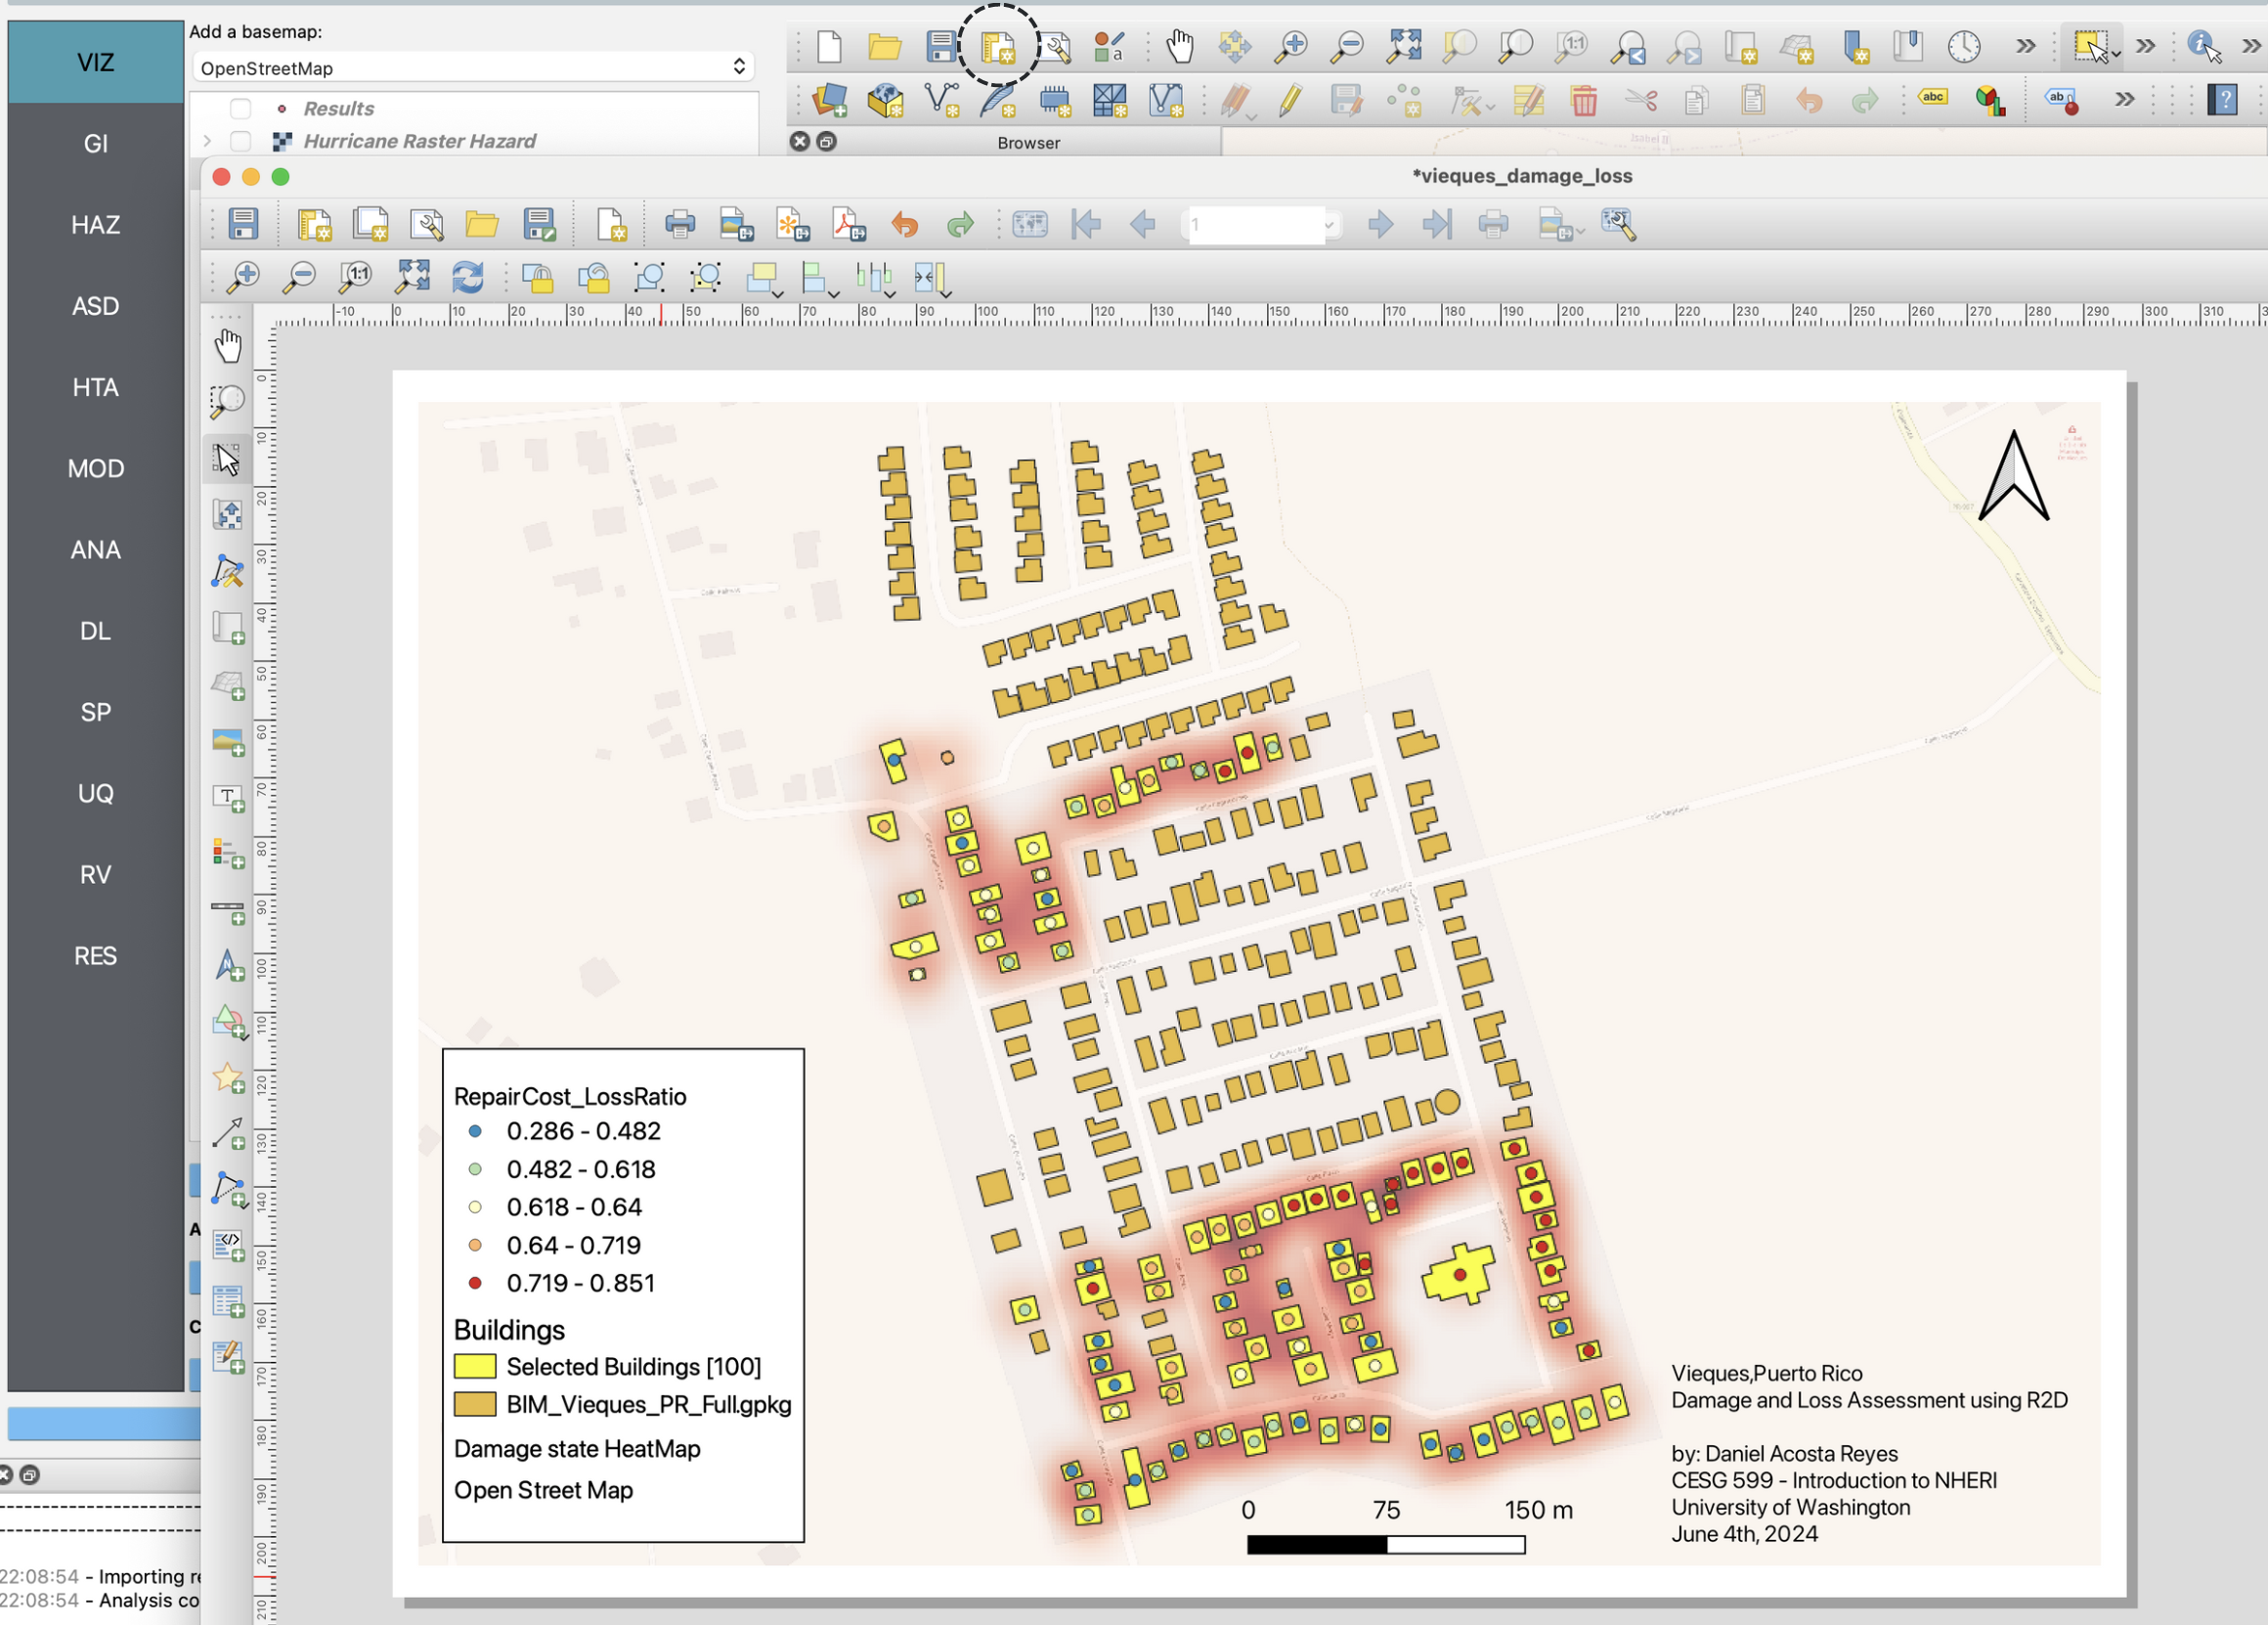
Results Visualization: R2D offers QGIS capabilities to visualize regional trends and produce mapping products. Fig. 13 shows an example of a map product using the QGIS module to create HeatMaps of the MostLikelyCriticalDamageState variable and the spatial distribution of the mean_RepairCost_loss_ratio for different intervals. Then, using the “New Layout” option you can create maps with legends, title, and other elements.
See QGIS Documentation for more.
Fig. 13. Mapping Visualization of Results Using QGIS in R2D.
Hurricanes are increasingly happening with more intensity and force due to climate change.
In locations such as Vieques, Puerto Rico, a comprehensive building inventory to assess huricane impact to infrastructure assets is limited. Assessing hazard exposure and consequences are key to increase resilience.
R2D possess vast capabilities to adress this challenge, allowing researches to input hazard data and construct building inventories with BRAILS tools.
This example provides strategies for creating building inventories in locations where data is scarce and implementing them in a format that could be used in R2D for regional analysis.